7 Jun 2026
Decoding Market Shifts: Liquidity Patterns and Odds Movements in Crowded Football Calendars Plus Prolonged Flat Racing Programs
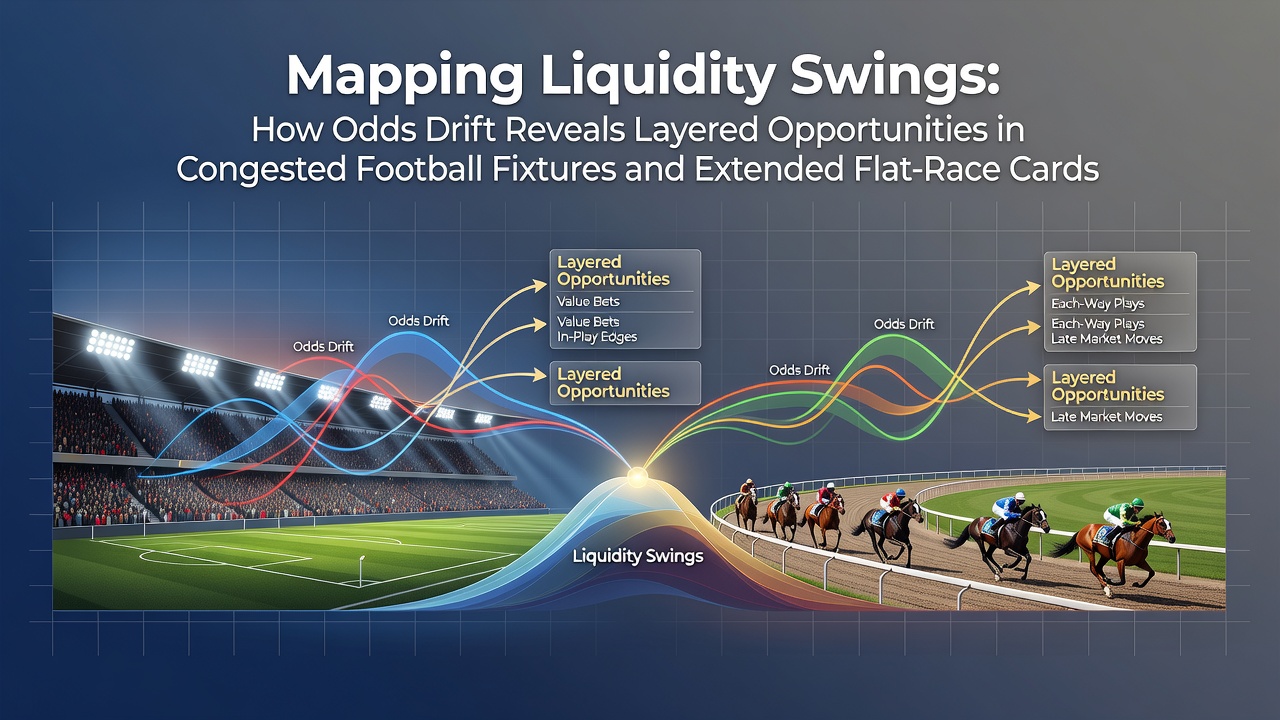
Market participants track liquidity swings through odds movements that often emerge when multiple football matches cluster on the same day alongside extended flat racing cards filled with consecutive events, and data from industry reports shows these patterns create layered opportunities as betting volumes redistribute across related selections.
Understanding Liquidity in Betting Contexts
Researchers at institutions such as the University of Nevada Las Vegas have examined how liquidity refers to the ease with which wagers enter and exit markets without substantial price changes, while odds drift occurs when those prices move in response to incoming money or shifts in perceived probabilities. Observers note that congested football schedules during periods like June 2026, when international tournaments overlap with domestic leagues resuming early fixtures, tend to concentrate liquidity in headline matches and leave thinner markets in supporting games where drift signals become more pronounced.
Flat racing programs that stretch across several days at major tracks similarly draw heavy early action on favorites, which can leave later races with drifting odds as layers adjust positions after initial waves settle. Those who monitor these movements often combine volume data with timing to identify where money has already committed versus where fresh liquidity might still flow.
Tracking Odds Drift Across Overlapping Events
Studies from Australian racing authorities indicate that drift frequently accelerates in the final hours before post time when multiple meetings run concurrently, because punters redistribute stakes from one card to another once early results alter perceived values. In football the same principle applies during midweek rounds packed with fixtures across different leagues, as initial odds on goal totals or correct scores adjust when large bets land on correlated outcomes such as over 2.5 goals in several simultaneous matches.
Experts have observed that the sequence of drift matters, with sharp early moves sometimes reversing once smaller layers enter and provide counter liquidity, whereas gradual sustained drift tends to reflect broader market consensus. People monitoring these sequences use historical datasets to compare current drift speeds against similar congested periods in prior seasons.
Layered Opportunities in Football and Racing Markets
One approach involves mapping primary drift in headline selections then scanning secondary markets for follow-on movements, and this method has appeared in research published through European betting analysis groups. During June 2026 schedules that combine European Championship qualifiers with domestic cup replays and lengthy flat racing festivals, the overlap creates multiple entry points where an initial drift in a football total goals market can precede or follow related drift in a horse racing place market.
Those analyzing such layers often look for instances where odds have drifted beyond historical averages for comparable fixtures, then check whether supporting data such as team news or track conditions align with the movement. Data from Canadian gaming associations shows that markets with lower initial liquidity exhibit wider drift ranges, which in turn can produce opportunities once equilibrium returns closer to event time.
Practical Mapping Techniques Used by Analysts
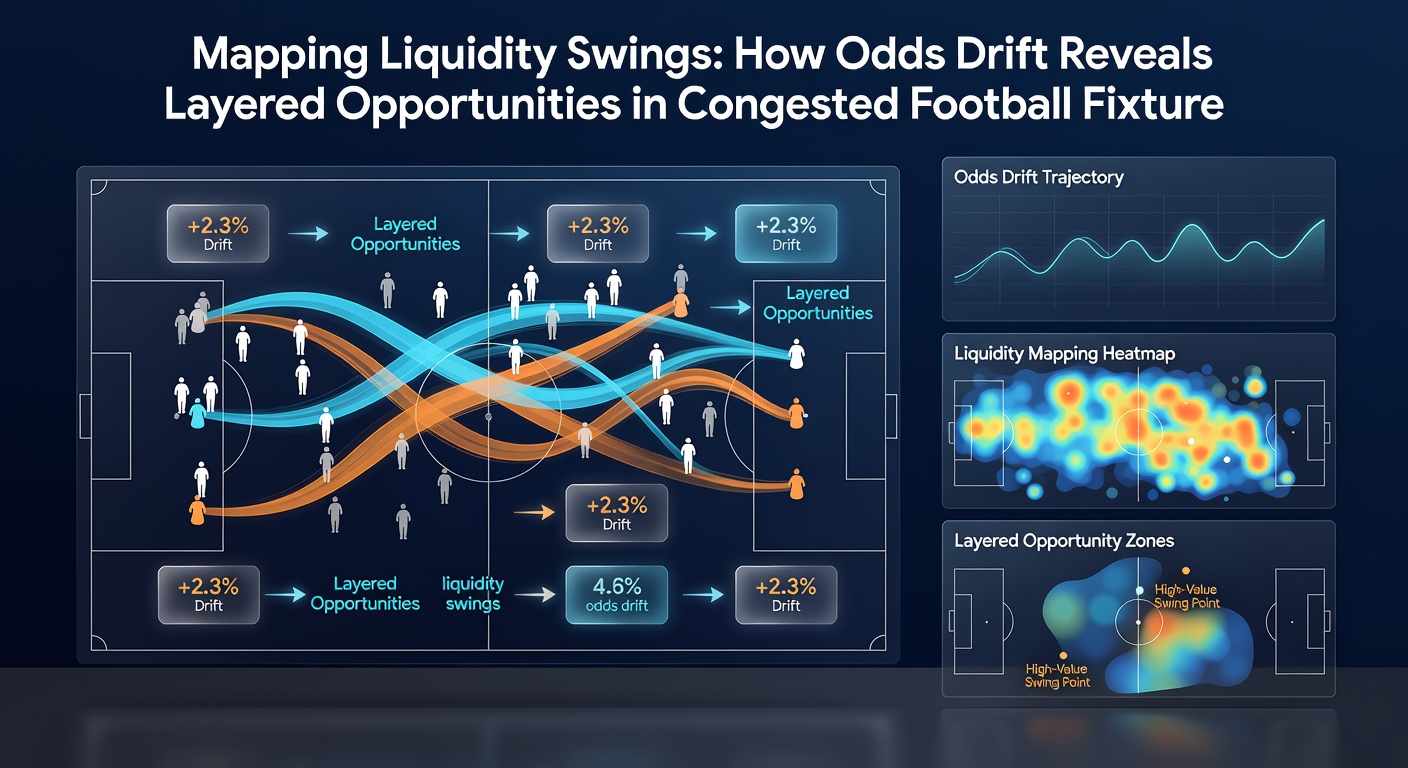
Analysts build timelines that mark when significant drift begins in each market, then overlay volume indicators to distinguish between informed and recreational flows, and this process draws on methodologies outlined in reports from the Racing and Wagering Western Australia board. In congested periods the technique highlights clusters where drift in one football match coincides with counter drift in a later flat race, allowing observers to trace how liquidity migrates across the broader card.
Additional layers emerge when comparing pre-event odds with in-play movements once matches or races start, because early drift often predicts the direction of live adjustments. Figures from academic papers on sports wagering reveal that markets experiencing above-average drift prior to congested fixture dates show higher variance in final outcomes relative to opening lines.
Conclusion
Mapping liquidity swings through odds drift provides a structured way to examine how betting markets respond when football fixtures pile up alongside extended flat racing programs, and ongoing data collection continues to refine these approaches. Observers note that consistent tracking across multiple seasons supplies the baseline needed to interpret current movements during periods such as June 2026, where overlapping calendars generate fresh instances for analysis.