6 Aug 2026
Decoding Form Cycles: Seasonal Insights for Weekend Football Fixtures and National Hunt Races
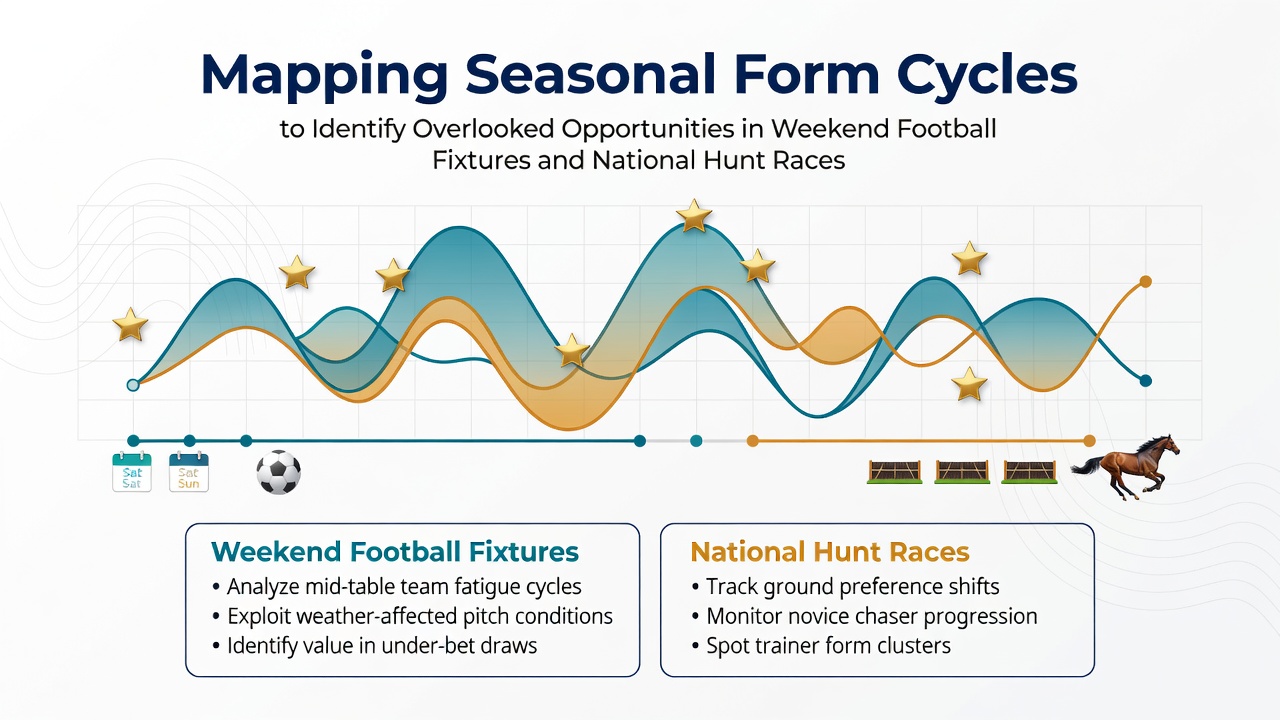
Analysts track seasonal form cycles by examining performance data across months and weather shifts, and this approach reveals patterns in weekend football fixtures as well as National Hunt races that often escape casual observation. Researchers compile results from league matches and jumps events, then map them against historical benchmarks to highlight periods when certain teams or horses deviate from expected outputs, while August 2026 brings renewed attention to early-season resets in both codes because pre-season training logs and ground conditions begin to influence outcomes more noticeably.
Establishing Baseline Form Metrics
Experts gather statistics on goals scored, clean sheets, and points per game for football sides, whereas National Hunt followers record win rates over hurdles and fences along with average finishing positions. Data aggregation tools sort these figures by month and home versus away status, creating layered profiles that show how squads adapt after international breaks or during fixture congestion. Observers note that combining these baselines with ground condition reports produces clearer signals about when overlooked opportunities arise, especially on weekends when public attention focuses on marquee clashes rather than mid-table encounters.
Seasonal Variations in Football Performance
Football teams exhibit measurable shifts in attacking output and defensive solidity as seasons progress, with early autumn weekends frequently featuring higher draw percentages because squads test new tactical setups after summer recruitment. Studies from sports analytics departments at institutions such as the University of Melbourne demonstrate that teams returning from European campaigns often post below-average expected goal numbers in August and September, creating windows where under-the-radar opponents deliver stronger results than odds suggest. Mapping these cycles involves cross-referencing travel schedules, pitch renovation dates, and historical head-to-head records so that patterns in weekend fixtures become visible before markets fully adjust.
National Hunt Cycles and Ground Influences
National Hunt racing follows its own rhythm, with summer jumps meetings giving way to autumn campaigns where softer ground favors stayers that performed modestly on firmer surfaces earlier. Form cycle mapping incorporates rainfall totals and course configurations, allowing analysts to identify horses that improve markedly once the calendar reaches October and November. Those who compile multi-year datasets find that certain trainers peak in specific windows, and weekend cards often contain races where market prices lag behind these recurring improvements because attention remains on headline events at larger tracks.
Integrating Data Across Both Sports
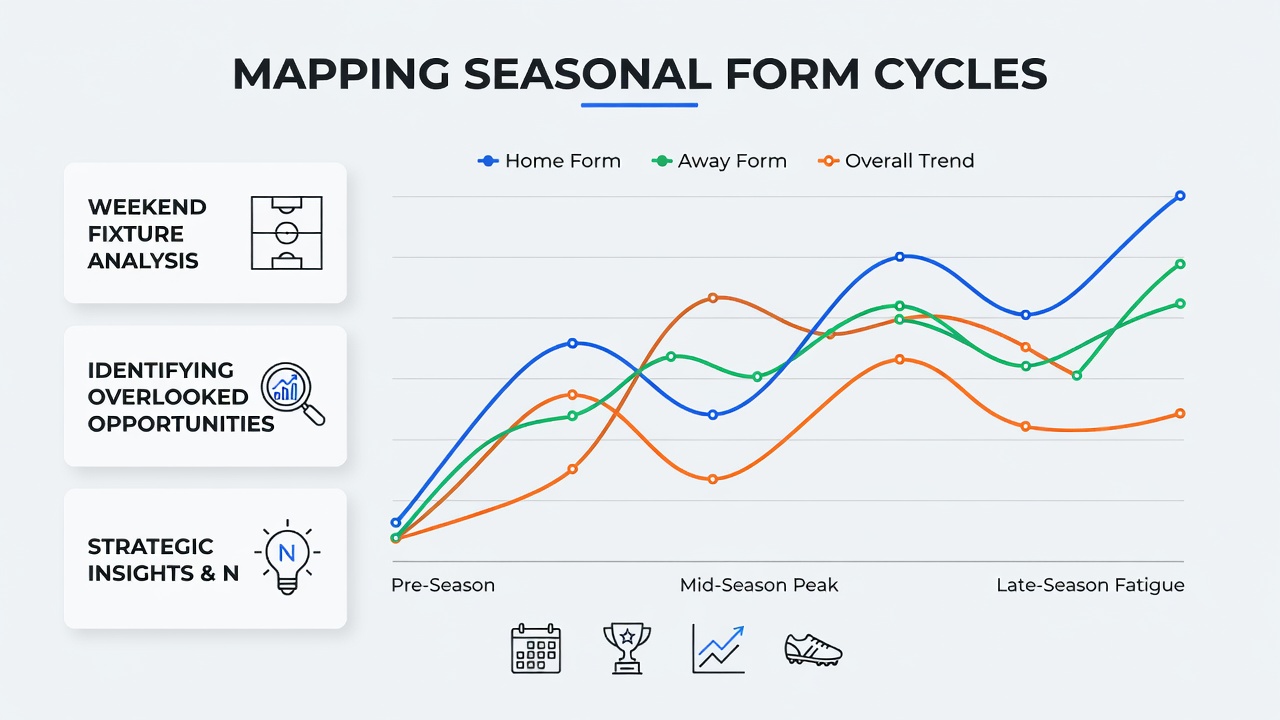
Combining football and National Hunt datasets requires alignment of time frames and variable weighting, since weekend football occurs on Saturdays and Sundays while jumps meetings spread across the same days at various venues. Practitioners apply correlation matrices that flag when form troughs in one sport coincide with peaks in the other, producing composite indicators for accumulator construction. Figures from the International Federation of Horseracing Authorities show that cross-sport seasonal mapping has gained traction among professional syndicates because it surfaces value in less obvious selections that single-sport bettors overlook.
Practical Application in Weekend Scheduling
Weekend football fixtures and National Hunt cards present concentrated data points that reward systematic review, and analysts build calendars marking high-potential windows based on prior seasons. For instance, early August 2026 schedules include Championship openers where promoted sides often exceed expectations in the first month, while jumps trainers with strong records at particular tracks post elevated strike rates once ground softens. Mapping these elements side by side lets observers isolate matches and races where public perception trails actual cycle positioning, and the resulting edges compound when selections align across both disciplines on the same day.
Conclusion
Seasonal form cycle mapping supplies a structured method for examining weekend football fixtures and National Hunt races, drawing on aggregated performance records and environmental factors to surface opportunities that standard analysis misses. Continued refinement of these techniques, supported by expanding datasets and improved modeling, maintains relevance as schedules evolve through 2026 and beyond.