4 Aug 2026
Charting Safe Passages: Bankroll Mapping Techniques for Value Hunters in Extended Betting Sequences
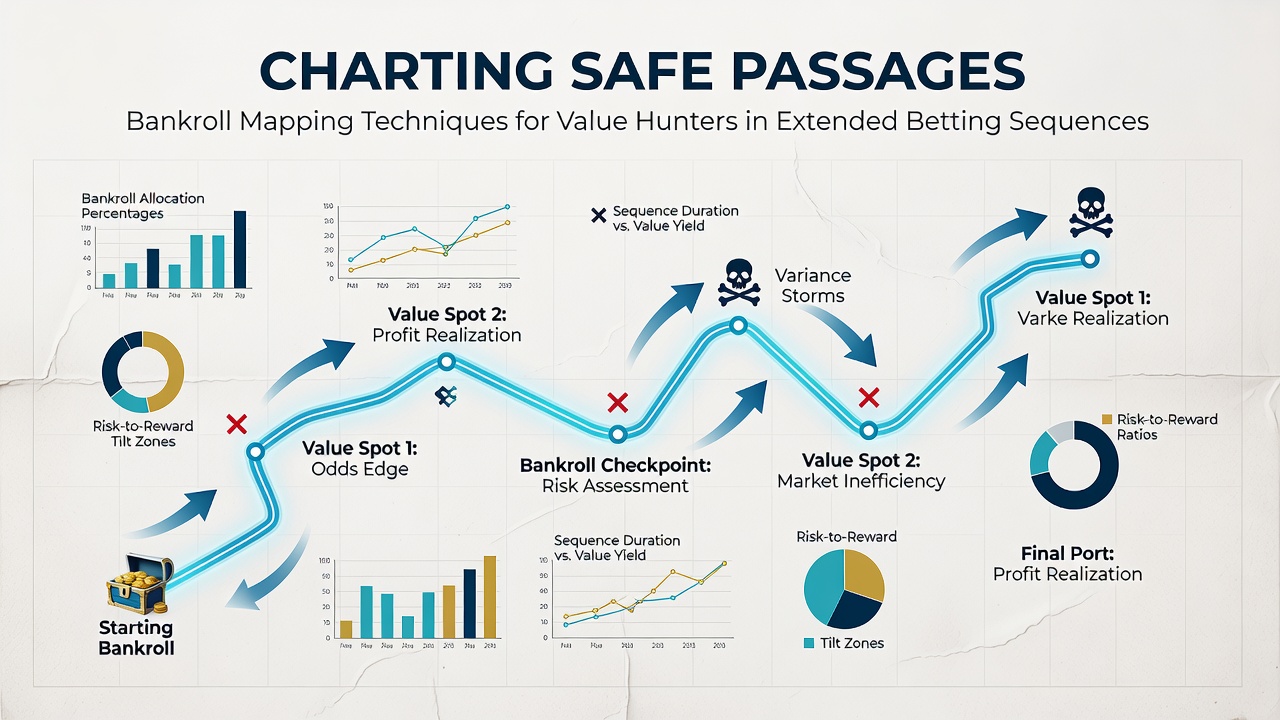
Bankroll mapping involves creating structured allocation frameworks that track stake distribution across multiple betting rounds while preserving capital during prolonged sequences in football and horse racing markets. Observers note that these frameworks help participants identify value entry points without exhausting reserves during extended runs of play. Data from industry reports indicate that structured mapping reduces variance exposure compared to unstructured approaches, particularly when sequences stretch beyond ten consecutive events.
Core Principles Behind Bankroll Allocation Maps
Allocation maps divide a total bankroll into segments designated for specific bet types and sequence stages, with clear boundaries that trigger adjustments as capital levels shift. Researchers discovered that dividing funds into fixed percentage bands allows value hunters to maintain consistent exposure even when early results turn negative. Those who've studied this approach often find that color-coded grids or digital overlays make it easier to visualize where the next stake should land relative to remaining reserves and upcoming opportunities in live markets.
August 2026 figures from North American regulatory bodies show continued growth in mobile betting volumes, which has increased demand for tools that handle longer sequences without manual recalculations. Mapping systems now integrate real-time odds feeds so adjustments happen automatically when value thresholds change mid-sequence.
Techniques for Plotting Extended Sequences
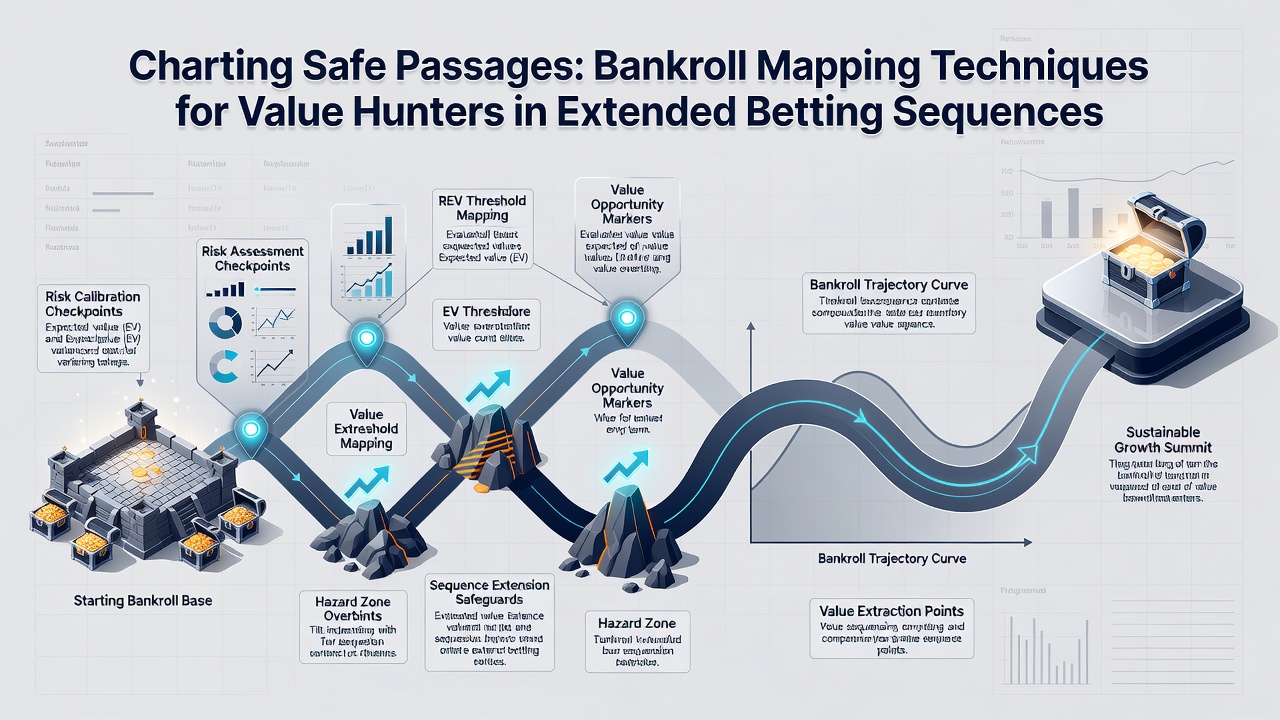
One effective method starts with a baseline percentage stake that scales according to the distance already traveled through a sequence and the number of remaining targeted bets. Experts have observed that applying a decreasing scale after the midpoint prevents over-commitment when later legs carry higher uncertainty. Another technique overlays historical performance bands onto the map so participants can see how similar past sequences behaved at each stage.
Take one researcher who examined accumulator chains across European football leagues and North American thoroughbred circuits; the analysis revealed that maps incorporating both win-rate projections and draw-frequency data produced more stable capital curves than single-metric versions. Value hunters apply these layered maps by marking safe passage zones where the combined probability exceeds a pre-set threshold, then locking in smaller stakes once those zones appear on the grid.
Integrating Real-Time Adjustments
Live markets require maps that update dynamically rather than remaining static after the first bet. According to the Alcohol and Gaming Commission of Ontario, real-time data integration has become standard practice among operators serving extended-sequence bettors. Participants adjust segment boundaries when odds movements alter the value calculation, moving capital from one zone to another without breaching overall limits.
What's interesting is how mapping software now flags when a sequence has entered a high-volatility corridor, prompting smaller unit sizes until conditions stabilize. This approach draws on patterns documented in peer-reviewed gambling studies that examined thousands of multi-leg wagers across different sports and racing jurisdictions.
Case Examples from Recent Seasons
There's this case where analysts reviewed sequences spanning the 2025-2026 football campaign and the Australian spring racing carnival; they found that bettors using mapped allocation preserved 18 percent more capital on average than those relying on flat staking. The maps highlighted specific points where pausing or reducing exposure aligned with historically weaker value windows, such as midweek fixtures or wet-weather sprints.
Another example comes from Canadian provincial data released in summer 2026, which showed increased adoption of visual mapping tools among users who place bets across both soccer and harness racing in the same session. These tools allow quick comparison of remaining bankroll against projected sequence length so decisions stay anchored to objective checkpoints rather than momentum alone.
Conclusion
Bankroll mapping supplies a visual and numerical structure that supports disciplined progression through extended betting sequences. The techniques rely on percentage segmentation, dynamic updates, and historical overlays that together mark safe passages while highlighting value opportunities. Evidence from regulatory reports and academic reviews continues to indicate measurable differences in capital retention when these frameworks replace unstructured staking methods. As markets evolve through 2026 and beyond, the core mapping principles remain adaptable across football, horse racing, and other continuous-play formats.